
The developer tools console is one of the most powerful tools available to you when it comes to debugging your front-end web applications. The console has an API that provides a number of methods that make debugging easier. It’s not uncommon to see developers using console.log() or console.dir() to investigate problems; but the developer tools console has a lot more to offer.
In this blog post you’re going to learn how to debug your web applications using the methods provided by the console API. Some browsers support more functionality than others so I’ll be pointing out any compatibility issues as we go.
Lets get started!
Using the Developer Tools Console
If you haven’t used the developer tools console before, don’t worry. In this section I’m going to show you how to access and use the console. If you’re already familiar this, feel free to skip to the next section.
There are a number of different ways that you can open your browser’s developer tools. The simplest is to just right-click somewhere on the page and then select ‘Inspect Element’ in the context-menu that appears.
You can also launch the developer tools using a keyboard shortcut. The shortcut for most browsers on Mac is Alt + Command + I, for Windows you can use Ctrl + Shift + I.
The developer tools console in Chrome.
Once you have the developer tools open you can switch to the console by clicking the Console tab at the top of the window.
![]()
The ‘Elements’ tab with a console pane at the bottom.
In Chrome, you can also launch a console below any of the other tabs by clicking on the console icon in the top right of the developer tools window.
Note: In this article we will be using the default developer tools that ship with browsers. There are many great browser extensions that can provide similar tools. Firefox users may wish to install Firebug, as the Firebug console supports some methods that the default Firefox console does not.
Now that you’ve got the console open, lets execute a simple statement.
Type the following into the console and press Enter:
console.log('Hello World!');
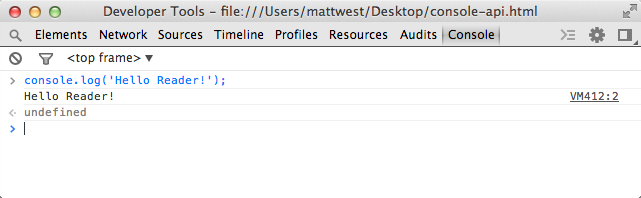
You should see that the test Hello World! is printed in the console (as shown below).
Using console.log() in the Chrome Dev Tools Console
Great! Now that you’re up-to-speed with how to use the console, lets take a look at all the console methods that you can use to debug your applications.
console.log(object [, object, …])
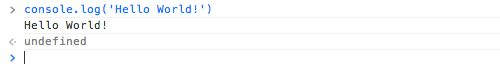
Lets start by looking at one of the most commonly used console methods, console.log(). This method simply outputs an object to the console.
console.log('Hello CodeCarrot');
If you list multiple objects they will be concatenated into a single, space-delimited string, which is then output to the console.
console.log('This is a string', { foo: 'bar' }, { bar: 'foo' });
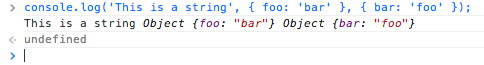
Using console.log() with multiple objects
The first parameter can contain format specifiers that allow you to define the format and positioning, of the subsequent objects.
var number = 11 * 9;
var color = 'red';
console.log('%d %s balloons', number, color);
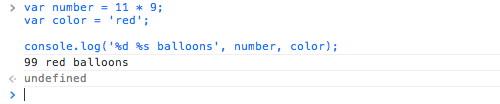
Using console.log() with format specifiers
The following format specifiers are supported in the dev tools console.
| FORMAT SPECIFIER | DESCRIPTION |
%s |
String |
%d or %i |
Integer |
%f |
Floating point value |
%o |
Expandable DOM element (as displayed in the ‘Elements’ tab of the dev tools) |
%O |
Expandable JavaScript object |
%c |
Formats the output using the CSS style you provide |
Using the %c format specifier allows you to style the console output.
console.log('%cThis text is styled!', 'color: #86CC00; background-color: blue; font-size: 20px; padding: 3px;')
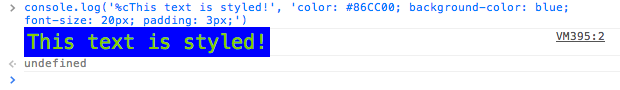
Using console.log() with styled output
console.assert(expression, object)
The console.assert() method takes two parameters, a boolean expression, and an object. If the result of the expression is false the object will be printed in the console.
You will usually want to use a string object as the second parameter but the method will work with any valid JavaScript object.
var count = 5;
console.assert(count > 10, 'count is not larger than 10');
The expression here checks to see if the count variable is larger than 10. If it’s not, the message ‘count is not larger than 10’ is printed in the console.
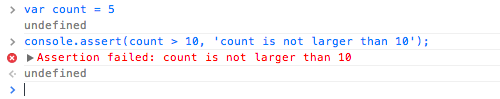
Using console.assert()
console.clear()
The console.clear() method clears any output in the console window.
Note: This method is not supported by the default Firefox developer tools, but is supported in the Firebug console.
console.count(label)
The console.count() method will output the number of times that the count() method has been called. You will only get an accurate count if this method is called at the same line, with the same label each time.
This method can be useful for finding out how many times a function is being called in your code.
function clickHandler() {
    console.count('Click handler called');
    ...
}
ProTip! You can enter multi-line expressions in the console by using Shift + Enter to create a new line.
You can test that this works by using a for loop in the console.
for (var i = 0; i < 3; i++) {
    clickHandler();
}
This code will call the clickHandler() method three times.
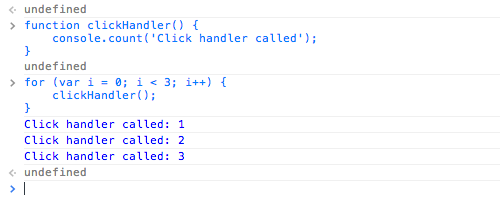
Using console.count() to count function calls
Note: This method is not supported by the default Firefox developer tools. Instead use the Firebug console.
console.dir(object)
The console.dir() method will print a JavaScript representation of the supplied object to the console. This method is especially useful for examining HTML elements, as it will display the DOM representation of the element rather than the XML representation displayed when using console.log().
console.dir(document.body);
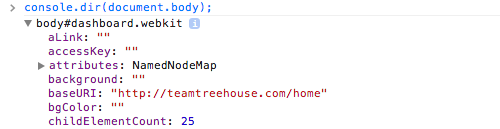
Using console.dir() to examine an HTML element
console.dirxml(object)
The console.dirxml() method prints the XML representation of on a object.
console.dirxml(document.body);
When used with a HTML element, the output is equivalent to using console.log().
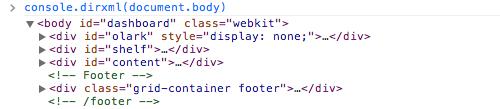
Using console.dirxml()
Note: This method is not supported by the default Firefox developer tools. Instead use the Firebug console.
console.error(object [, object, …])
The console.error() method takes one or more objects and prints them to the console. This method is similar to console.log() however console.error() will also print a stack trace from where the method was called. The output will also be flagged as an error in the console.
console.error('Page not found (404)');
This method is really useful when writing error handlers.
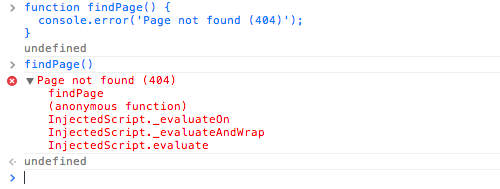
Logging console errors with console.error()
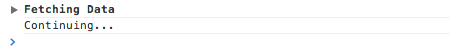
console.group(object[, object, …]) & console.groupEnd()
The console.group() method is used to group together a series of log messages. Once this method is called, any further log messages will be added to the group until console.groupEnd() is executed to close the group.
You can specify an optional title to make it easier to find the group in the console.
console.group('Fetching Data');
Grouping console messages with console.group()
It is possible to nest multiple groups within one another.
console.group('Group One');
console.group('Group Two');

...

console.groupEnd(); // Close group two
console.groupEnd(); // Close group one
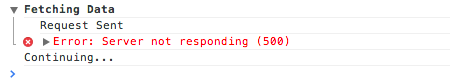
console.groupCollapsed(object[, object, …])
The console.groupCollapsed() method is essentially the same as console.group() except that the group is initially displayed collapsed rather than open in the console.
console.groupCollapsed('Fetching Data');

console.log('Request Sent');
console.error('Error: Server not responding (500)');

console.groupEnd();

console.log('Continuing...');
Grouping log messages with console.groupCollapsed()
console.info(object [, object, …])
The console.info() method functions in the same way as console.log() with the exception that log messages are given the info flag. This can be handy as the developer tools console has a feature that allows you to filter log messages using flags.
console.info('Hello CodeCarrot');
Note the blue info icon to the left of the log message in the image below.
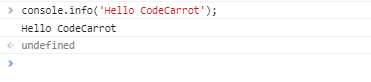
Logging info messages with console.info()
console.profile([profile]) & console.profileEnd()
The console.profile() method will start a new JavaScript CPU profile if the developer tools are open. You have the option to specify a label for the profile if you wish.
The console.profileEnd() method will complete the profile.
function animationUI() {
    console.profile('Animating');

    // Animate something...

    console.profileEnd();
}
This example shows how you might use the profile() method to create a new CPU profile for the animateUI() function.
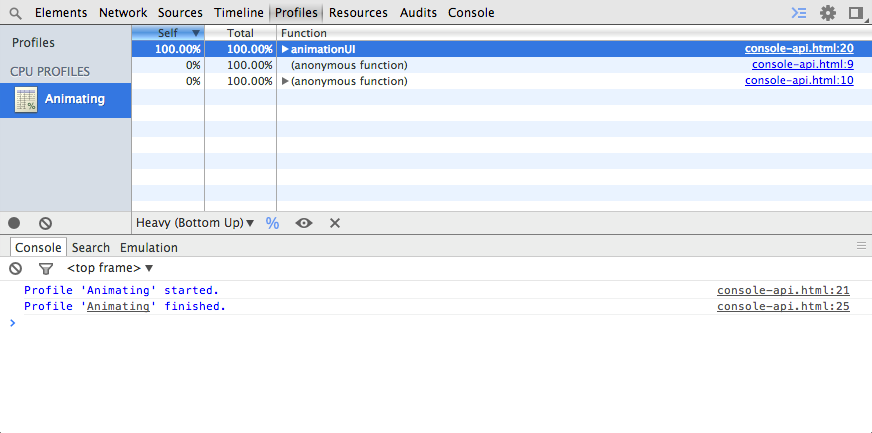
Creating a JavaScript CPU Profile with console.profile()
console.table(data)
The console.table() method allows you to output structured data as an interactive table in the console.
var data = [
    {first_name: 'Matt', last_name: 'West', occupation: 'Programmer'},
    {first_name: 'Vince', last_name: 'Vaughn', occupation: 'Actor'},
    {first_name: 'Larry', last_name: 'Page', occupation: 'CEO'}
];

console.table(data);
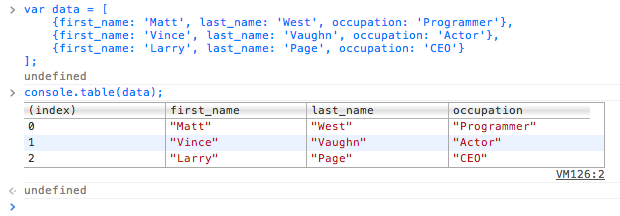
Creating interactive tables with console.table()
This method can be really handy for examining data returned by an AJAX call.
Note: This method is not supported by the default Firefox developer tools. Instead use the Firebug console.
console.time(label) & console.timeEnd(label)
The console.time() and console.timeEnd() methods give you a way of timing how long it takes for a piece of code to execute. Both the time() and timeEnd() methods should be passed the same label parameter.
console.time('Draw frame');

// Execute some code...

console.timeEnd('Draw frame');
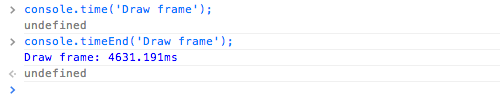
Timing code execution with console.time()
console.timeline(label) & console.timelineEnd(label)
The console.timeline() and console.timelineEnd() methods allow you to make a new timeline recording in the Chrome developer tools.
You have the option to specify a label for the new timeline. As with console.time(), this label must be the same in the calls to console.timeline() and console.timelineEnd().
console.timeline('Google Search');

// Do some work.

console.timelineEnd('Google Search');
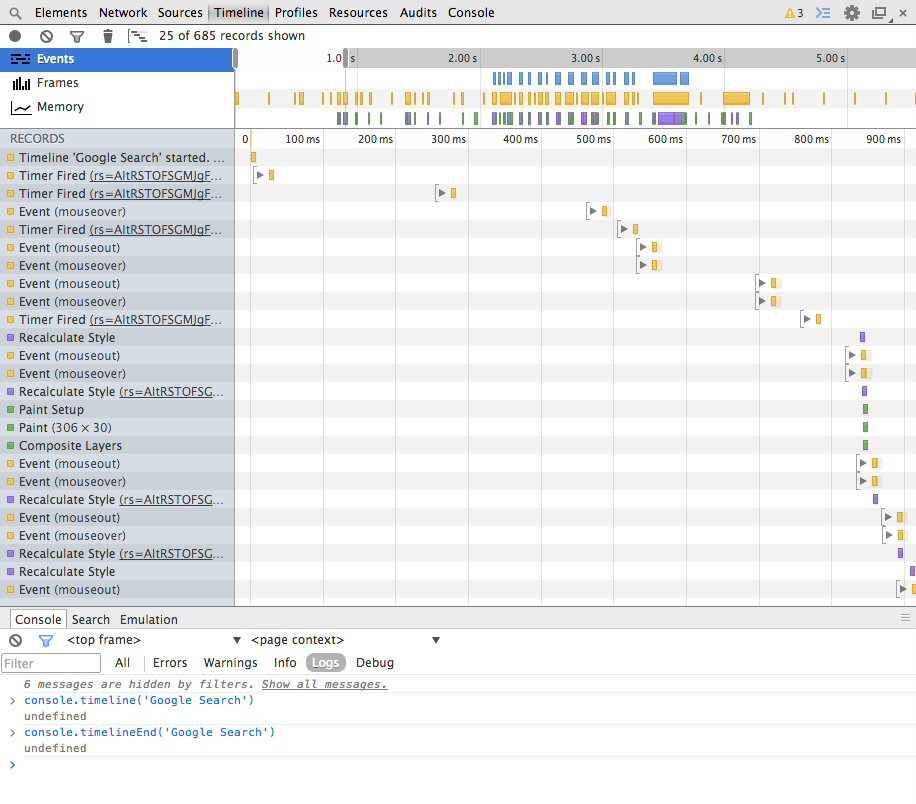
Creating timelines in Chrome with console.timeline()
Note: The timeline methods are only available in the Chrome developer tools.
console.timeStamp(label)
You can manually add events to the timeline using the console.timeStamp() method. This method can be passed a label to help you identify the marker in the developer tools.
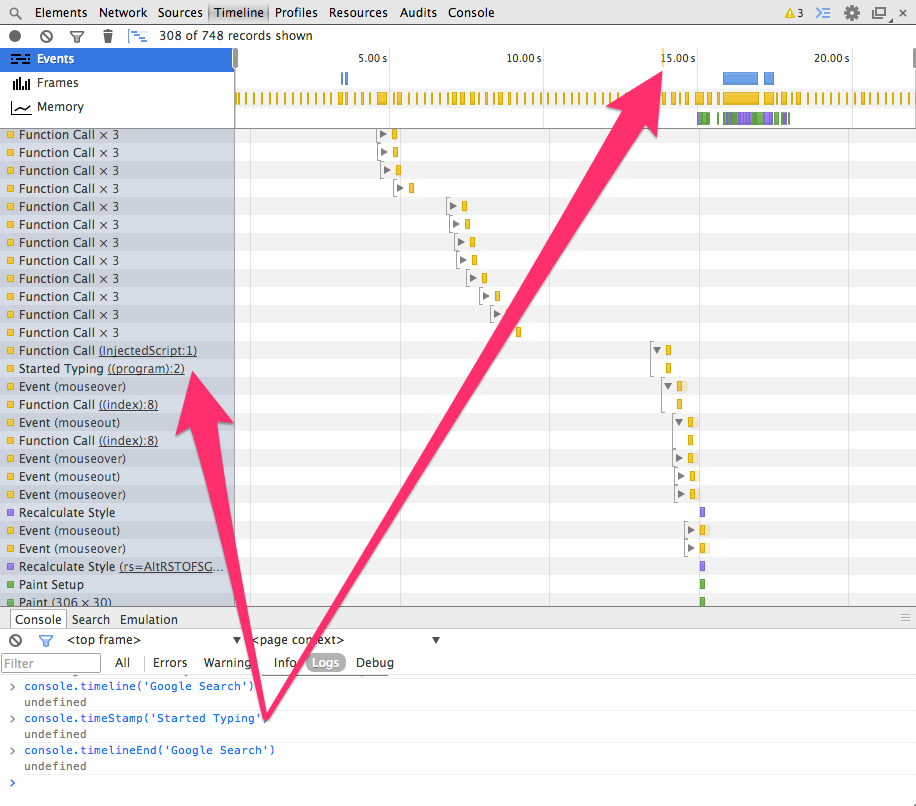
Creating timeline markers with console.timeStamp()
Note: This method is only supported in Chrome. It was previously called console.markTimeline().
console.trace()
The console.trace() method will print a stack trace for the point at which the method was called.
console.trace();
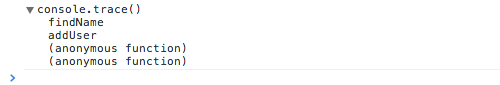
Using console.trace() to print a stack trace
console.warn(object [, object, …])
Finally, the console.warn() method will log a message to the console with a warning flag.
console.warn(‘This is a warning.’);
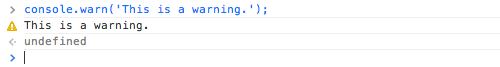
Logging warning messages with console.warn()
Summary
In this post you’ve learned about the various console methods that you can use to debug your web applications. You’ll find that you use some of these methods more than others, but it’s certainly useful to understand what can be achieved through the developer tools console.
I recommend that you check out some of the links in the Further Reading section below, especially dev tools tips and tricks from the Google Developers website.
What tools do you like to use when debugging your front-end web applications? Share your favorites in the comments below.
Response to “Mastering The Developer Tools Console”